The “Dashboard” page is the first page that appears upon opening the WordPress appointment plugin if you are logged in as an “Administrator” or “Amelia Manager” user role. The “Dashboard” view summarizes monitoring information about all appointments, services, employees, and revenue. The dashboard is divided into three main sections, providing different information in each.
Video version
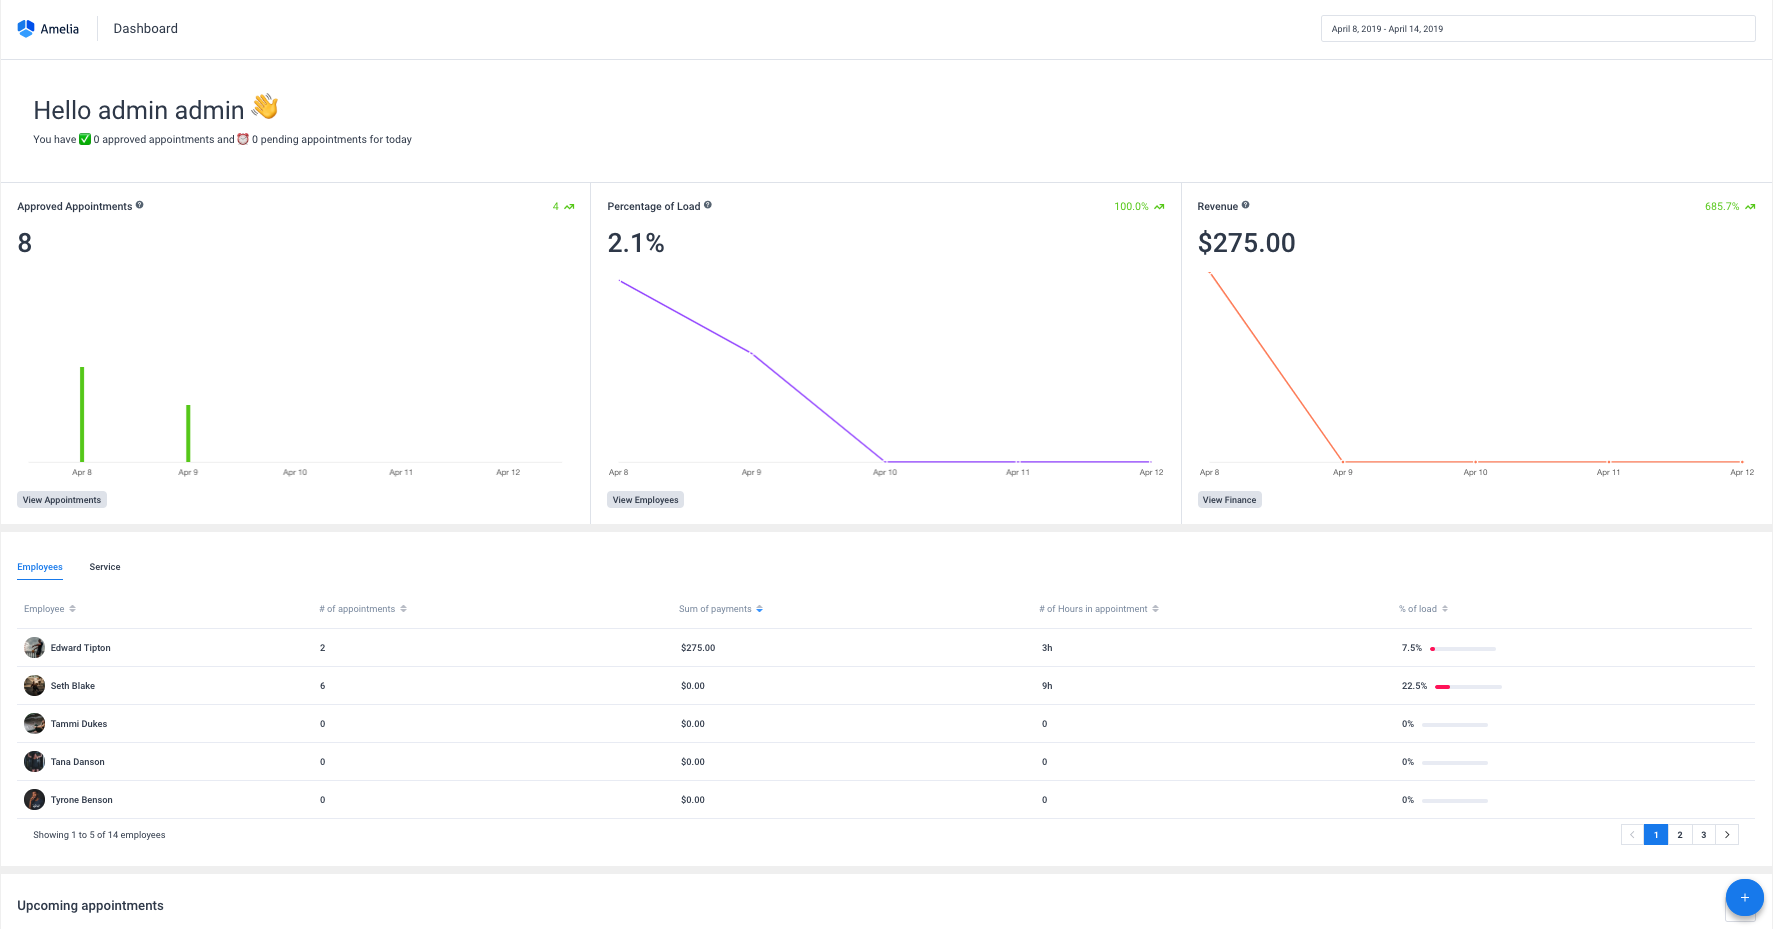
Datepicker, with the predefined dates range, is on the top of the page and by default, it filters the data in the first, second and fourth dashboard sections and for the current week. It is predefined in a range of seven days, and the first day of the week has been set according to the WordPress ‘Week Starts On” setting. You can modify the date range in the date picker which will cause data in the first three sections to be updated.

The first section of the dashboard shows metrics for the current date range selection and is divided into three blocks:
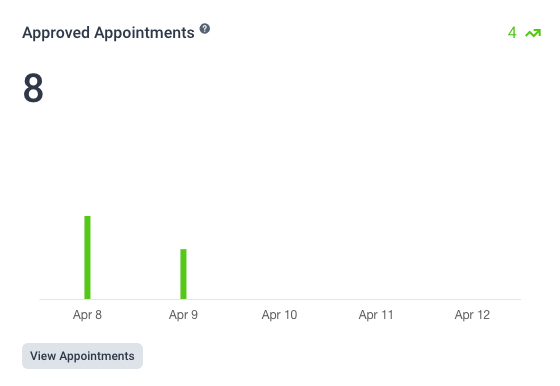
- Approved Appointments – This metric represents the number of approved appointments based on the date range you choose. In the chart below the number, you can see how many approved appointments were for each date in the selected date range. By clicking on the “View Approved Appointments” link below metric, you will be taken directly to the “Appointments” page. You’ll see appointments with the “Approved” status in the date range that has been previously set on the “Dashboard” page. The metric in the upper right corner of the Approved Appointments block shows the increase/decrease compared to the same period in the past (for example, if you select a range of 7 days, this number will show the change compared to the previous 7 days).
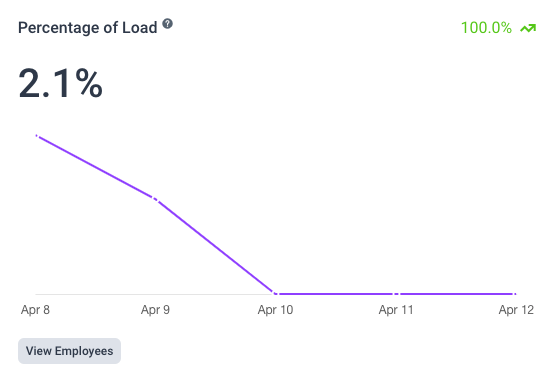
- Percentage of load – This metric shows the percentage of load for all approved appointments for a chosen date range. It is calculated as the number of occupied hours/number of total working hours for the whole company. As for the Approved appointments, the chart below shows the percentage of load for each date in the chosen date range. In the upper right corner, you will see another metric that shows the increase/decrease compared to the previous period.
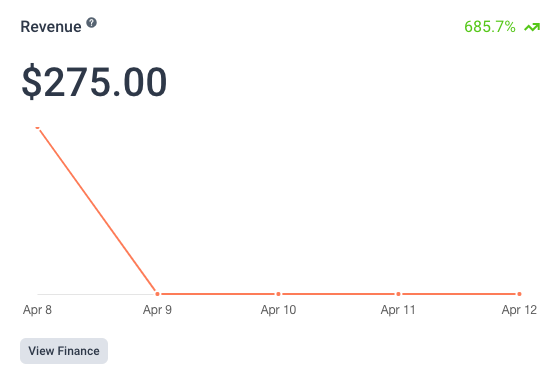
- Revenue – This metric represents the amount of money a company received during a selected period (based on approved appointments and finalized payments). Clicking the “View Revenue” link will take you to the “Finance” page with a predefined date picker in the date range that has been previously set on the “Dashboard” page. The chart below the metric shows the revenue for each date in the selected date range so you can see how your payments behaved during the selected period. In the upper right corner, you can see the increase/decrease in revenue compared to the previous period.
The second section of the Dashboard shows the table in which you can see detailed data for each employee or service for the selected date range. The table contains five columns:
- Employee/Service column in which you can see all your employees/services and sort them by name,
- Number of appointments which represents the total number of approved appointments for each employee/service for a selected date range,
- Sum of payments which represents the total amount of paid appointments for each employee/service for a selected date range,
- Number of hours in appointment which represent the total number of scheduled hours for each employee/service for a selected date range,
- Percentage of load which represents the detailed view from the metric above shown for each employee/service for a selected date range. It is calculated as the number of scheduled hours (for approved appointments) / amount of total working hours for employee/service.

Each column can be sorted so you can easily see which employee/service has the largest number of scheduled (approved) appointments, revenue, number of scheduled hours, or percentage of the load.
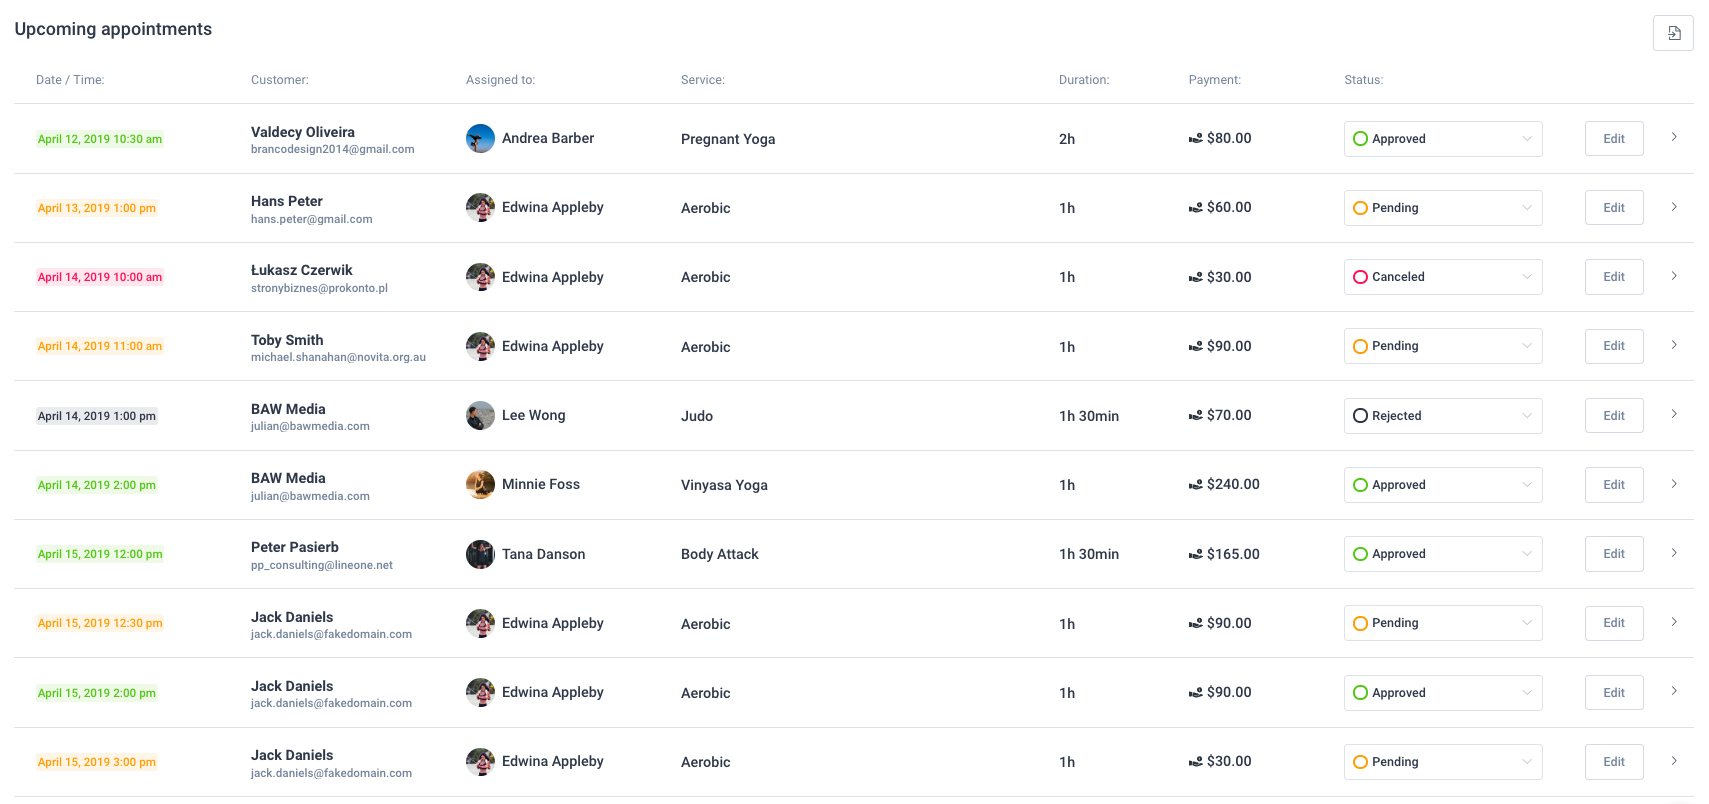
The third section of the WordPress booking system dashboard shows “Upcoming appointments”. This table provides information about the next ten appointments that are scheduled including the time of the appointment, the customer(s), employee, service, duration, and payment method. You can expand an appointment row by clicking on it. An expanded record shows the information about the customer(s) phone, customer(s) email, and information added in the custom fields. You can quickly change the appointment status by choosing from four available appointment statuses from the drop-down.
To edit an existing appointment, click on the “Edit” button to the right of the appointment you want to change. Clicking on the “Edit” button will open an edit dialog that allows you to update the data in the existing appointment. If this button is disabled, then the appointment has passed and it can not be changed.
At the top right side of this list of today’s appointments, you will see an Export button, so you can easily export the list of today’s appointments in a CSV file.
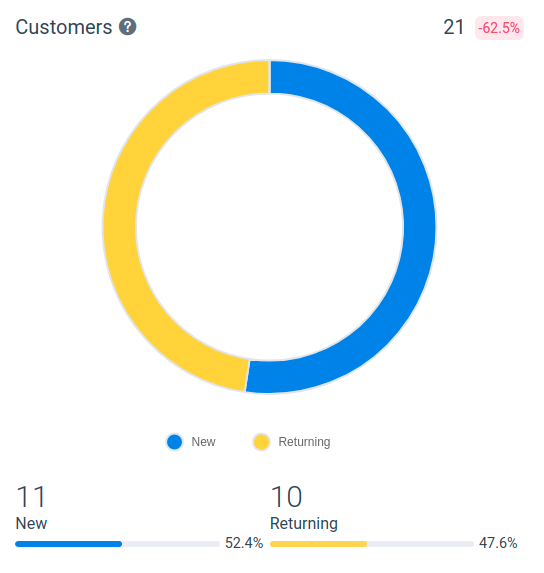
The fourth section of the dashboard displays your data in charts, so you can easily see which services, employees, and locations are your primary earners and how many new/returning customers you are onboarding. You’ll see data for the date range that you’ve set above.
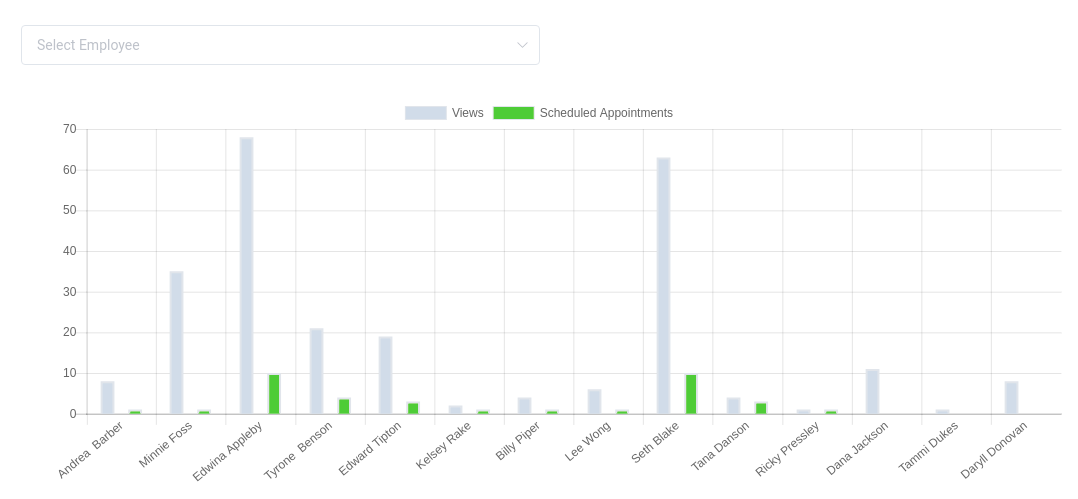
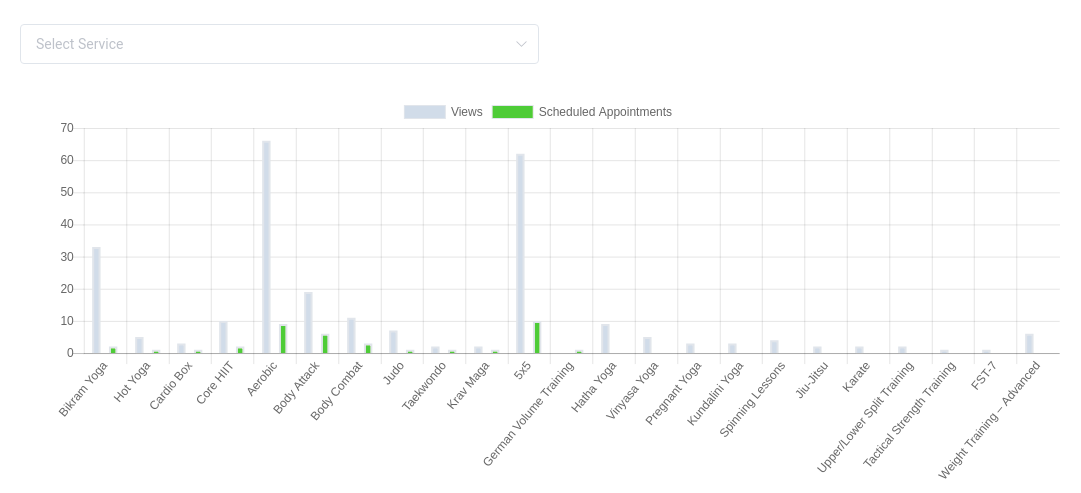
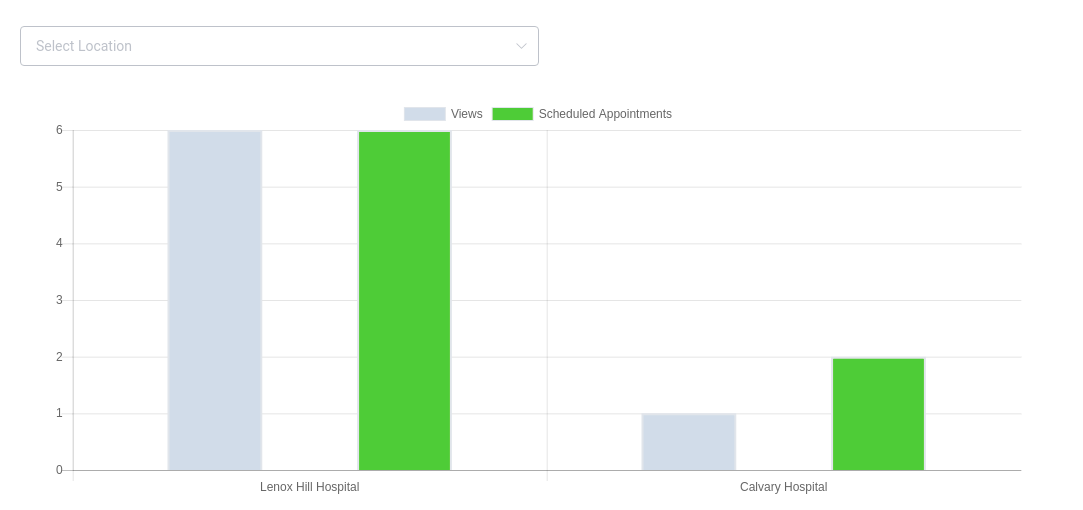
The left side of the section is divided into three tabs. These column charts display “Interests / Conversions” data:
- Employees’ Interests / Conversions – This chart displays a comparison of interests in making an appointment with an employee against arranged appointments with the employee for the selected period, broken down by employees’ names. When the “Confirm Booking” modal is open to the customer, interest in selected employees increases by 1.
- Services Interests / Conversions – This chart displays a comparison of interests in making a service appointment against an arranged service appointment for the selected period, and is broken down by service names. When the “Confirm Booking” modal is open to the customer, interest in the selected service increases by 1.
- Location Interests / Conversions – This chart displays a comparison of interests in making an appointment at the selected location against arranged appointment at the selected location for the selected period, and is broken down by location names. When the “Confirm Booking” modal is open to the customer, interest in the selected location increases by 1.
The right side of the section displays customer data in a pie chart so you can easily see the number of new and returning customers. The percentage at the top-right corner of the chart shows your customer increase or decrease based on the date range you choose. For example, if you pick May 14, 2018 – May 20, 2018, the percentage will show you how this range compares to the last week, May 7, 2018 – May 13, 2018. If you had 4 customers from May 7, 2018 – May 13, 2018, and 6 customers from May 14, 2018, to May 20, 2018, the percentage will show a 50% increase.
In the bottom right corner of the “Dashboard”, you can click on the “+” (plus icon) button to quickly add a new customer or schedule a new appointment.