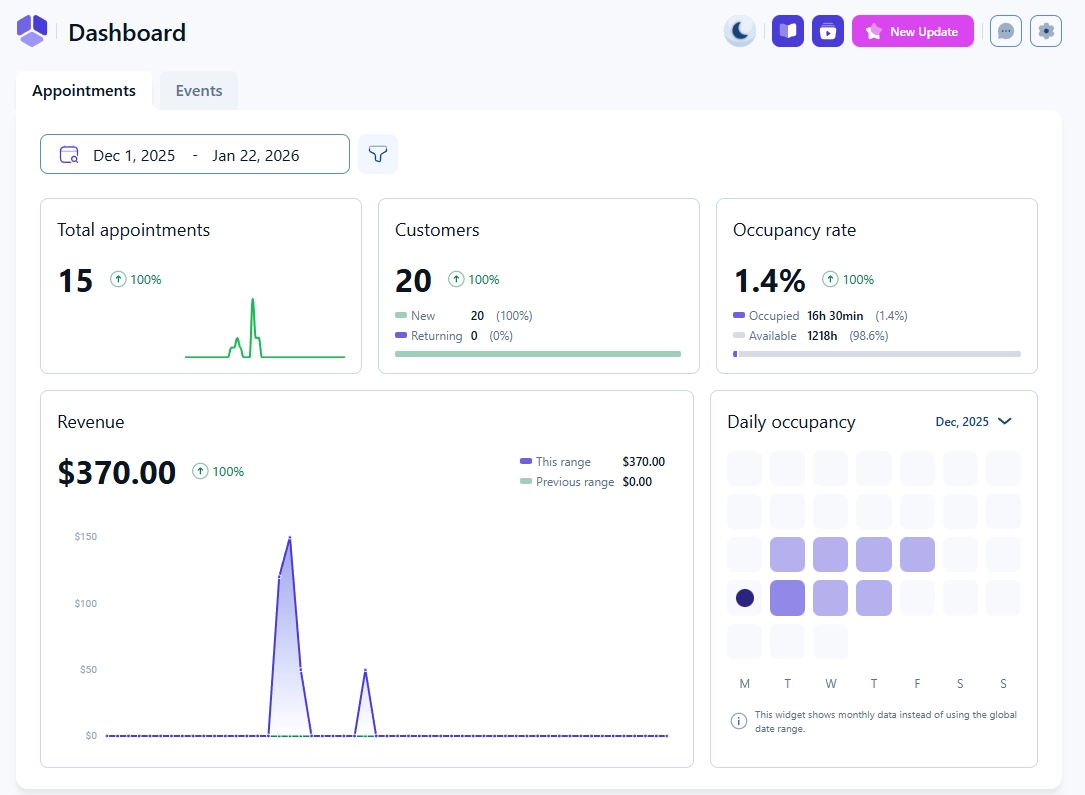
Limited time discount Book Smarter This Christmas
Up to 50%Off

How does the Dashboard work in Amelia

The Dashboard is the main landing page in Amelia and provides an overview of booking activity for a selected date range. It includes key performance metrics, customer insight, revenue data, upcoming bookings, and top trends.

You can change the default landing page in Settings → General settings. The Dashboard is divided into the Appointments tab and the Events tab, and each tab displays metrics relevant to that booking type.

Overview of the Amelia Dashboard with appointments and events tabs

How do the date range and filters work?

The date range picker at the top of the Dashboard lets you select the period for which metrics are displayed. Next to the date range, filters allow you to narrow the results shown in each tab.

  • Appointments tab filters: service, employee, location
  • Events tab filters: event, employee, tag

These filters update all Dashboard sections, including totals, revenue, occupancy, upcoming bookings, and top trends, based on the selected range and criteria.

How are total appointments calculated?

Total appointments displays the number of booked appointments within the selected date range. This number reflects only appointments created during the chosen period and updates automatically when using filters.

How does the customers section work?

The Customers metric shows how many people booked appointments during the selected period and splits them into new and returning. This helps identify customer growth and repeat engagement.

How is the appointments occupancy rate calculated?

The Occupancy rate compares the duration of booked appointment hours with the total available time. It shows:

  • Occupied hours and their percentage
  • Available hours and their percentage

This lets you understand how efficiently your business hours are being used.

Date range selector, filters, total appointments, customers, and occupancy rate displayed in Amelia's dashboard

How does revenue reporting for appointments work?

Revenue displays the total income from appointments in the selected date range. Hovering over the chart reveals exact values per date and compares the current range to the previous period.

Daily occupancy uses color intensity to show how many appointments were booked each day; clicking a day displays its exact occupancy percentage.

Revenue graph and daily occupancy heatmap for appointment data

How do upcoming appointments work?

The Upcoming appointments table shows all upcoming bookings after today’s date. It includes:

  • Date and time
  • Customer name(s)
  • Employee
  • Service (with Zoom, Google Meet, or Microsoft Teams icons if enabled)
  • Duration
  • Amount paid
  • Status

You can adjust how many rows are shown per page, check the total number of upcoming appointments, use pagination, and jump to a specific page using the Go to field.

Upcoming appointments table with service, customer, payment, and status information

What are appointment top trends?

The Top trends section shows performance summaries for employees, services, and packages.

  • Employees and Services include: number of appointments, sum of payments, total hours, and percentage of load
  • Packages include: package name, sum of payments, and times purchased

All columns can be sorted to quickly identify strong performers or underused segments.

Top trends section for employees, services, and packages in Amelia

What does the Events tab show?

The Events tab summarizes activity related to group events, workshops, classes, or any scheduled sessions created through Amelia. It reflects newly created events, attendee activity, and engagement trends.

Events tab with total events, attendees, and occupancy rate displayed

How are total events calculated?

Total events shows the number of new events created during the selected date range. It does not count recurring instances of the same event unless each is created as a separate event.

How does the attendees metric work?

The Attendees section shows how many users booked at least one event during the selected period. It also displays how many were new versus returning.

How is event occupancy measured?

Event Occupancy rate shows the number of booked attendee spots compared to the total available spots in all events during the selected timeframe. Both amounts and percentage values are shown.

How does revenue reporting for events work?

The Revenue graph for events shows income generated from event bookings during the selected period, along with a comparison to the previous period.

Daily occupancy reflects how many event spots are filled per day and uses color intensity to represent activity level.

Revenue chart and daily occupancy grid for event data in Amelia

How do upcoming events work?

The Upcoming events table lists all future events with details such as:

  • Date and time
  • Event name
  • Status (Open, Closed, Full)
  • Booked capacity
  • Organizer
  • Staff

You can change the number of rows shown per page, view the total number of upcoming events, and navigate using pagination or the Go to option.

Upcoming events table with booking and status information in Amelia

What are event top trends?

The Top trends section in the Events tab highlights the most active or successful events. It includes:

  • Event name
  • Number of bookings
  • Sum of payments
  • Percentage of load

All columns are sortable to help you quickly identify high-performing or low-performing events.

Event top trends table showing bookings, payments, and load percentage

What should I keep in mind when using the Dashboard?

  • The Dashboard always reflects the currently selected date range and filters.
  • Daily occupancy uses color shading to show busier versus quieter days.
  • Most tables allow sorting to help analyze performance quickly.
  • Zoom, Google Meet, and Microsoft Teams icons appear only when those integrations are active in event or appointment services.
  • Upcoming bookings show data only for future appointments or events.